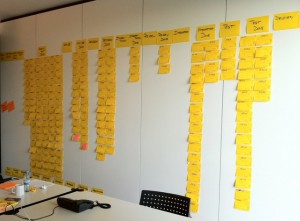
One of the principles of Kanban is to visualize the work in progress. In an Agile pilot, often one of the first steps is to build a Kanban board. The amount of work visualized on the board is surprising in most cases. Here’s one example.
The other day I was building a Kanban board for my customer. My job was to help him as an Agile Coach with an Agile pilot in his department.
After a value stream mapping, we wrote all the column names on big sticky notes and attached them to a wall in one of the meeting rooms. 18 columns, including activities, buffers and queues.
Afterwards we mapped the work via tickets. I asked the customer what he thought would be the number of tickets his department was working on. He assumed that it would be about 100 tickets.
My customer already used a ticket system. He queried the system, and out came the impressive number of 201 tickets. We mapped them on sticky notes and put them on the wall. What an impressive picture we just created!
We immediately began to analyse the situation. Here are some of the first impressions:
- The actual amount of tickets in the system was more than double the assumed amount of tickets in the system. Think of the hidden mental weight the people of the department had to carry around with them all the time! Such misconception is not unusual: A colleague of mine once had a customer with 500 tickets in the company’s system, far more than the employees thought they would have.
- Some of the tickets were really old. The oldest was 5 years old. That’s not unusual when you visualize work on a Kanban board. It’s easy to hide stuff in an electronic system, but it’s hard to do that on a physical board. Besides, when you face the challenge to put 201 tickets on a board, space is scarce, so “needless” tickets bug you even more.
- We immediately saw bottlenecks. “Why are there so many tickets ready for delivery, but not already delivered? What are they waiting for?” my customer asked justifiably.
- There was no distinction between an action and waiting for an action. Where the electronic ticket system only had a state for an action, like e.g. “Implementation”, the Kanban board had two states, “Analysis Done” and “Implementation”. So, without asking the employees who were working on the ticket, we couldn’t figure out if a ticket was in a waiting state or in an action state.
- The biggest bottleneck was the first ready column. There were almost 100 tickets in it, and there was no order in them. This was not only a show stopper, but also a flow stopper: The system was jammed right from the beginning.
It took us about half a day with 5 people to map the value stream, and another half a day with 3 people to build the board. I’d say that time already paid off, given the findings we had.


